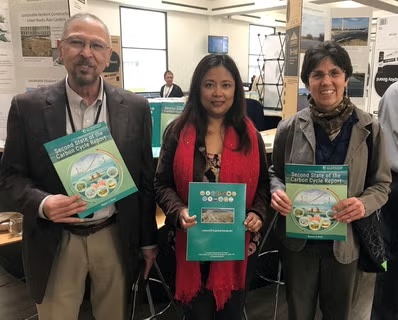
New State of the Carbon Cycle Report (SOCCR2) Website Released on Earth Day
The new State of the Carbon Cycle Report (SOCCR2) website was released on Earth Day.

The new SOCCR2 site is equipped with a new design and many new user-friendly and interactive features including:
- Full content of report now available as web content, in addition to downloadable PDFs;
- Sections and figures including links for direct sharing via social media;
- Full metadata accessible for figures and tables, as powered by the USGCRP Global Change Information System (GCIS);
- Enhanced full search capabilities within the entire 878page assessment document.
Incorporating 19 chapters distributed across four interconnected sections (I. Synthesis, II. Human Dimensions of the Carbon Cycle, III. State of Air, Land, and Water, IV. Consequences and Ways Forward), SOCCR2 assesses the last decade of cross-sectoral carbon cycle advances across the U.S., Canada and Mexico in the global context. This 878 pages decadal interagency U.S. Government assessment involved over 200 diverse experts from multiple nations working together over 3 years, producing over 6 drafts that collectively underwent over 6 rounds of formal reviews by diverse stakeholders including the U.S. National Academy of Sciences, the general public and 13 federal agencies and departments before its release.
Recommended citation for this special decadal assessment of North American Carbon Cycle:
USGCRP, 2018: Second State of the Carbon Cycle Report (SOCCR2): A Sustained Assessment Report. [Cavallaro, N., G. Shrestha, R. Birdsey, M. A. Mayes, R. G. Najjar, S. C. Reed, P. Romero-Lankao, and Z. Zhu (eds.)]. U.S. Global Change Research Program, Washington, DC, USA, 878 pp., doi: 10.7930/SOCCR2.2018
An excerpt from the Assessment
'...Central to life on Earth, carbon is essential to the molecular makeup of all living things and plays a key role in regulating global climate. To understand carbon’s role in these processes, researchers measure and evaluate carbon stocks and fluxes. A stock is the quantity of carbon contained in a pool or reservoir in the Earth system (e.g., carbon in forest trees), and a flux is the direction and rate of carbon’s transfer between pools (e.g., the movement of carbon from the atmosphere into forest trees during photosynthesis). This document, the Second State of the Carbon Cycle Report (SOCCR2), examines the patterns of carbon stocks and fluxes—collectively called the “carbon cycle.” Emphasis is given to these patterns in specific sectors (e.g., agriculture and energy) and ecosystems (e.g., forests and coastal waters) and to the response of the carbon cycle to human activity. The purpose of SOCCR2 is to assess the current state of the North American carbon cycle and to present recent advances in understanding the factors that influence it. Concentrating on North America—Canada, the United States, and Mexico—the report describes carbon cycling for air, land, inland waters (streams, rivers, lakes, and reservoirs), and coastal waters....'

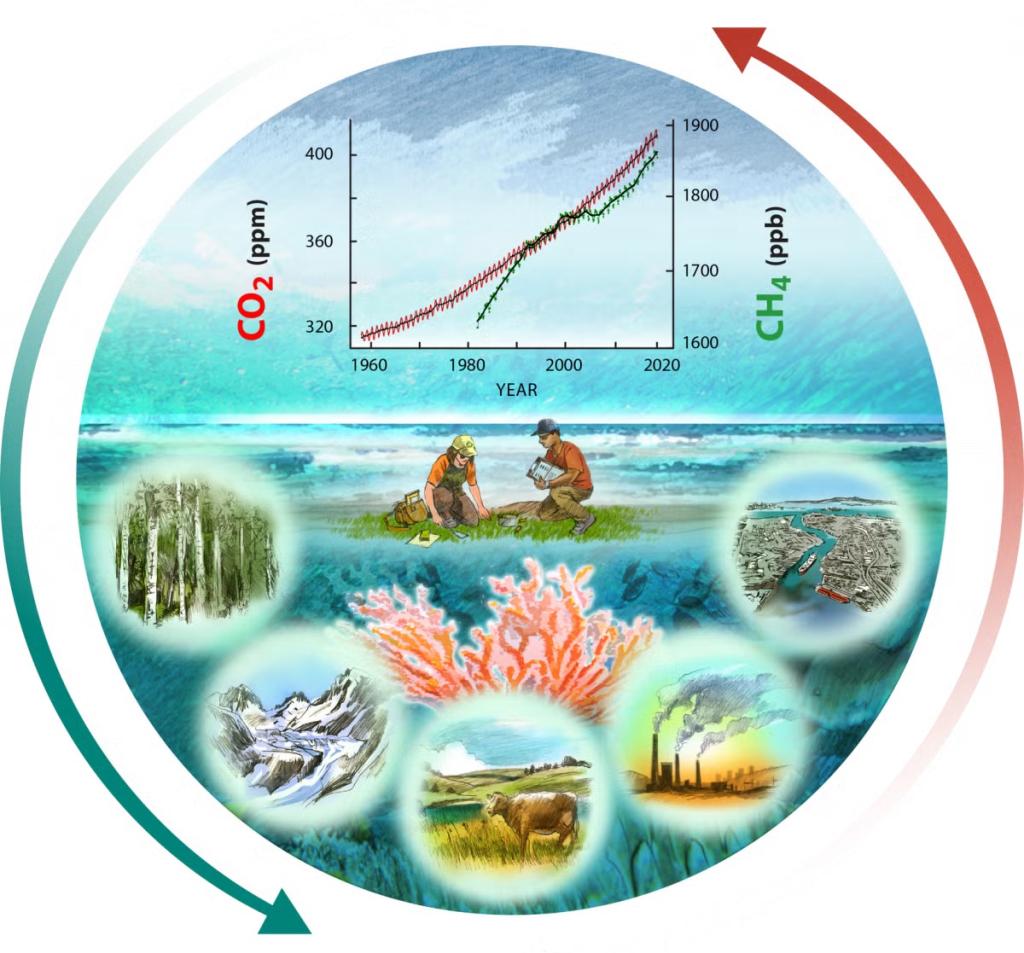
Report Cover Figure: North American carbon cycling illustration, courtesy Ron Oden, University of Nevada, Reno.
This graphic represents the dynamic nature of carbon stocks and fluxes in the United States, Canada, and Mexico described in the Second State of the Carbon Cycle Report.
The center sketch of researchers taking soil samples pays tribute to the hundreds of scientists who served as authors for this report and the thousands of researchers whose data were used throughout the document.
Arrows depict carbon emissions to the atmosphere (red) and carbon uptake by different land types and aquatic environments (teal), processes described in Ch. 1: Overview of the Global Carbon Cycle and Ch. 2: The North American Carbon Budget.
Plotted data—collected by the National Oceanic and Atmospheric Administration’s Earth System Research Laboratory—show monthly means of atmospheric carbon dioxide (CO2) concentrations (red curve in parts per million) taken at the Mauna Loa Observatory and monthly means of methane (CH4) concentrations (green curve in parts per billion) from globally averaged marine surface sites. Deseasonalized data are depicted by the black lines (Ch. 8: Observations of Atmospheric Carbon Dioxide and Methane).
Coral reefs, fish, and beaches represent carbon processes in coastal waters (Ch. 15: Tidal Wetlands and Estuaries and Ch. 16: Coastal Ocean and Continental Shelves). These are key areas experiencing carbon cycle changes due to direct effects of increasing CO2 (Ch. 17: Biogeochemical Effects of Rising Atmospheric Carbon Dioxide).
Forests (first inset, lower left) and their soils represent the largest terrestrial carbon sink in North America. Factors influencing the strength of this sink and trends in disturbances such as wildfire, insects, and land-use change are described in Ch. 9: Forests.
Mountains with melting glacier (second inset, lower left) illustrate the effects of greenhouse gas–induced warming on carbon cycling, particularly in high-latitude and boreal areas (Ch. 11: Arctic and Boreal Carbon).
Pastoral scene (center inset, bottom) captures the interdependent carbon cycling processes among different terrestrial and aquatic systems (Ch. 5: Agriculture, Ch. 7: Tribal Lands, Ch. 10: Grasslands, Ch. 12: Soils, Ch. 13: Terrestrial Wetlands, and Ch. 14: Inland Waters).
Power plant (second inset, lower right) illustrates carbon fluxes from the energy sector and other human systems and their potential impact on future carbon cycling (Ch. 3: Energy Systems and Ch. 19: Future of the North American Carbon Cycle).
Coastal city and port (first inset, lower right) represent the many ways carbon is embedded in social systems and the different levels of information and "The processes and structures that steer society and the multiplicity of actors who are involved. Institutional arrangements of governance comprise the sets of rules, norms, and shared practices that underlie decision making." governance involved in carbon decision making (Ch. 4: Understanding Urban Carbon Fluxes, Ch. 6: Social Science Perspectives on Carbon, and Ch. 18: Carbon Cycle Science in Support of Decision Making).


