Carbon Cycle Science Databases and Tools
The following centers and websites host, display or provide assessment platforms for carbon cycle science data and tools from different sources and ecosystems at diverse spatial and temporal scales. Please note that the content on this page originates from the original (hyperlinked) sources with minimal editorial changes.
Data Sources and Centers
North American Carbon Program (NACP) Data
NACP MsTMIP: Global and North American Driver Data for Multi-Model Intercomparison Data
Second State of the Carbon Cycle Report (SOCCR2)
Coastal Carbon Research Coordination Network (CCRCN)
Rapid Assessment of U.S. Soil Carbon (RaCA)
Carbon Dioxide Information Analysis Center (CDIAC)
International Soil Carbon Network (ISCN)
NOAA Earth System Research Laboratory
Surface Ocean CO2 Atlas (SOCAT)
Oak Ridge National Laboratory Distributed Active Archive Center (ORNL DAAC)
National Greenhouse Gas Emissions Data (Inventory of U.S. Greenhouse Gas Emissions and Sinks)
Tools
North American Carbon Program (NACP) Data
The NACP includes diverse projects and activities. Agencies fund projects led by Principal Investigators (PI) through grants or contracts (extramural) as well as by identifying funding for government laboratories or research centers (primarily intramural). Agencies also commit activities within standing programs to address NACP goals and objectives or to supply specific measurements or data sets for NACP. Additionally, the NACP draws on numerous research programs and data sources that are not involved directly in the program and that have primary missions or goals that differ from those of NACP. Thus, the NACP requires flexible criteria for designating participating projects and investigators.
CCIWG members and agency program managers designate projects and investigators within their areas of responsibility as official participants in the NACP based on broad guidelines defining core and affiliated projects. If your project meets the criteria, you may submit your project for consideration to be included in the NACP.
NACP MsTMIP: Global and North American Driver Data for Multi-Model Intercomparison Data
This data set provides environmental data that have been standardized and aggregated for use as input to carbon cycle models at global (0.5-degree resolution) and regional (North America at 0.25-degree resolution) scales.The data were compiled from selected sources and integrated into gridded global and regional collections of climatology variables (precipitation, air temperature, air specific humidity, air relative humidity (NA only), pressure, downward longwave radiation, downward shortwave radiation, and wind speed), time-varying atmospheric CO2 concentrations, time-varying nitrogen deposition, biome fraction and type, land-use and land-cover change, C3/C4 grasses fractions, major crop distribution, phenology, multiple soil characteristics, and a land-water mask. The driver data are sufficient for carbon cycle model simulations from 1801 to 2010. The temporal resolution ranges from 3-hourly for climate to monthly for CO2-atm and phenology to annual for N-deposition and landcover.These data were compiled specifically for the North American Carbon Program (NACP) Multi-Scale Synthesis and Terrestrial Model Intercomparison Project (MsTMIP) as the prescribed model input driver data (Huntzinger et al., 2013). The driver data were used by 22 terrestrial biosphere models to run baseline and sensitivity simulations. The standardized data provided consistent model inputs to minimize the inter-model variability caused by differences in environmental drivers and initial conditions. Together with the sensitivity simulations, the standardized input data enable better interpretation and quantification of structural and parameter uncertainties of model estimates.
Global Carbon Budget Data
The annual update of the Global Carbon Budget is possible thanks to many institutions, observational networks and modeling groups around the world. All datasets and modeling output to complete the Global Carbon Budget 2012 are described in detail in Le Quere et al. (2012) [http://bit.ly/UY8GTQ] All datasets contributing to this year’s update have been integrated in one single file. It is archived at CDIAC doi: http://dx.doi.org/10.3334/CDIAC/GCP_V2012 (Excel, 263kb)
Coastal Carbon Research Coordination Network (CCRCN) Data Clearinghouse
The CCRCN is a 'consortium of biogeochemists, ecologists, pedologists, and coastal land managers with the goal of accelerating the pace of discovery in coastal wetland carbon science by providing our community with access to data, analysis tools, and synthesis opportunities.' The consortium curates a Data Clearinghouse that offers infrastructure and tools for accessing, visualizing, and summarizing data. It also runs the Coastal Carbon Atlas as a feature of their Data Clearinghouse, enabling users to visualize, query, and download data directly from the CCRCN database, including raw data and a catered bibliography.
Rapid Assessment of U.S. Soil Carbon (RaCA)
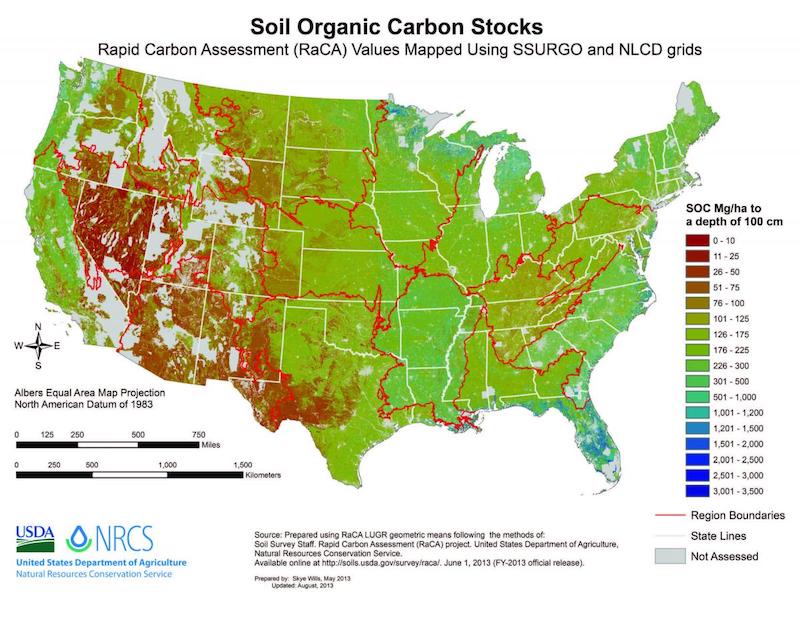
The Rapid Assessment of U.S. Soil Carbon (RaCA) was initiated by the USDA-NRCS Soil Science Division in 2010 with the following objectives:
- 44,833 samples were collected from the upper 1 meter of 32,084 soil profiles at 6,017 randomly selected locations for measurement of organic and inorganic carbon by visible and near infrared (VNIR) spectroscopy and bulk density by traditional methods. NRI sites were used as the basis for random selection of sample sites stratified by soil group within RaCA Region and land use/land cover (LULC) within soil group. Soil morphology and landscape characteristics were described at each site and limited vegetation and agricultural management information was collected from each location. Sample collection and analysis involved more than 300 soil scientists and assistance from 24 universities.Reference: Soil Survey Staff. Rapid Assessment of U.S. Soil Carbon (RaCA) project. United States Department of Agriculture, Natural Resources Conservation Service. Available online at http://soils.usda.gov/survey/raca/. June 1, 2013 (FY2013 official release).To develop statistically reliable quantitative estimates of amounts and distribution of carbon stocks for U.S. soils under various land covers and to the extent possible, differing agricultural management.
- To provide data to support model simulations of soil carbon change related to land use change, agricultural management, conservation practices, and climate change.
- To provide a scientifically and statistically defensible inventory of soil carbon stocks for the U.S.
Carbon Dioxide Information Analysis Center (CDIAC)
The CDIAC was the primary climate-change data and information analysis center of the U.S. Department of Energy (DOE), included the World Data Center for Atmospheric Trace Gases. Its data holdings comprised:
- Records of the atmospheric concentrations of carbon dioxide and other radiatively active gases;
- The role of the terrestrial biosphere and the oceans in the biogeochemical cycles of greenhouse gases;
- Emissions of carbon dioxide from fossil-fuel consumption and land-use changes;
- Long-term climate trends;
- The effects of elevated carbon dioxide on vegetation; and
- The vulnerability of coastal areas to rising sea level.
International Soil Carbon Network (ISCN) (formerly the National Soil Carbon Network)
The International Soil Carbon Network (ISCN) is a scientific community devoted to the advancement of soil carbon research. The Network coordinates independent soil research and monitoring efforts in the United States and internationally. ISCN members contribute to a community-driven soil carbon database and use available data to prepare scientific papers and large-scale syntheses.Overarching these goals is the need for a spatially explicit approach, since measurements of soil C storage, turnover, and vulnerability all vary at spatial scales from several meters to thousands of kilometers, as well as across different depths within an individual soil profile. In addition to database development, modeling, and mapping, the Network also facilitates topical workshops, peer-reviewed publication, and presentations at professional conferences.
NOAA Earth System Research Laboratory
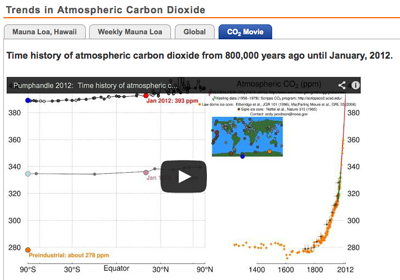
The Global Monitoring Division of NOAA/Earth System Research Laboratory has measured carbon dioxide and other greenhouse gases for several decades at a globally distributed network of air sampling sites [Conway, 1994]. A global average is constructed by first fitting a smoothed curve as a function of time to each site, and then the smoothed value for each site is plotted as a function of latitude for 48 equal time steps per year. A global average is calculated from the latitude plot at each time step [Masarie, 1995]. Data are reported as a dry air mole fraction defined as the number of molecules of carbon dioxide divided by the number of all molecules in air, including CO2 itself, after water vapor has been removed. The mole fraction is expressed as parts per million (ppm). Example: 0.000400 is expressed as 400 ppm.
Surface Ocean CO2 Atlas (SOCAT)
At the “Surface Ocean CO2 Variability and Vulnerability” (SOCOVV) workshop at UNESCO, Paris in April 2007, co-sponsored by IOCCP, SOLAS, IMBER, and the Global Carbon Project, participants agreed to establish a global surface CO2 data set that would bring together, in a common format, all publicly available fCO2 data for the surface oceans. (The fugacity of carbon dioxide, or fCO2, is the partial pressure of CO2 (pCO2) corrected for non-ideal behaviour of the gas.) This is an activity that has been called for by many international groups for many years, and has now become a priority activity for the marine carbon community. This data set will serve as a foundation upon which the community will continue to build in the future, based on agreed data and metadata formats and standard 1st level quality-control procedures, building on earlier agreements established at the 2004 Tsukuba workshop on “Ocean Surface pCO2 Data Integration and Database Development”. This activity also supports the SOLAS and IMBER science plans and their joint carbon implementation plan.
National Greenhouse Gas Reporting Program (GHGRP) and Inventory of U.S. Greenhouse Gas Emissions and Sinks
The EPA Greenhouse Gas Reporting Program (GHGRP) is a relatively new program that collects detailed emissions data from the largest greenhouse gas emitting facilities in the U.S. While the Inventory provides high level perspective needed to understand the United States’ total emissions or “carbon footprint,” the GHGRP provides the detailed information that helps us better understand the sources and types of greenhouse gas emissions at individual facilities. This information can help industry identify opportunities for reduction and help communities identify nearby sources of greenhouse gas emissions. This data can be used to compare facilities or industries, track emissions from one year to the next, inform policy at the state and local levels, and provide important information to the finance and investment communities. Data from these two programs can be used to answer common questions about U.S. greenhouse gas emissions. For example, the Inventory could help users find the contribution of the transportation sector, or the power sector, to total U.S. greenhouse gas emissions. The Greenhouse Gas Reporting program could help users find the biggest stationary sources of greenhouse gas emissions in a region.
U.S. Greenhouse Gas Center Data
The U.S. Greenhouse Gas Center is a relatively new multi-agency effort (including NASA, EPA, NIST, and NOAA) that consolidates greenhouse gas data information from models and observations for researchers, climate change mitigation practitioners, policymarkers, data providers, and public community members. The US GHG Center was launched on December 4, 2023 at COP28, and in its current development period: the three areas of focused data publication are natural GHG sources, sinks, fluxes, and patterns; human-caused GHG emissions; and methane emission leak events. The portal uses open source principles and techniques so that users can broadly access data and products from NASA (e.g., EMIT and OCO-2/3), NIST (e.g., NIST tower data), NOAA, and EPA sources (e.g., regulatory and research datasets).
COMET-FARM™
This is a whole farm and ranch carbon and greenhouse gas accounting system. The tool guides you through describing your farm and ranch management practices including alternative future management scenarios. Once complete, a report is generated comparing the carbon changes and greenhouse gas emissions between your current management practices and future scenarios.
Other carbon cycle data sources
DATA.GOV
Raw data at DATA.GOV
Research.gov
Led by the National Science Foundation (NSF), Research.gov improves customer service for the research community by increasing access to information and services while streamlining and standardizing business processes among partner agencies. Research.gov is also a transparent source for information about federal research spending and outcomes for the general public. (Search for 'carbon' in the search box at the top right for new carbon cycle science highlights.)